TL;DR
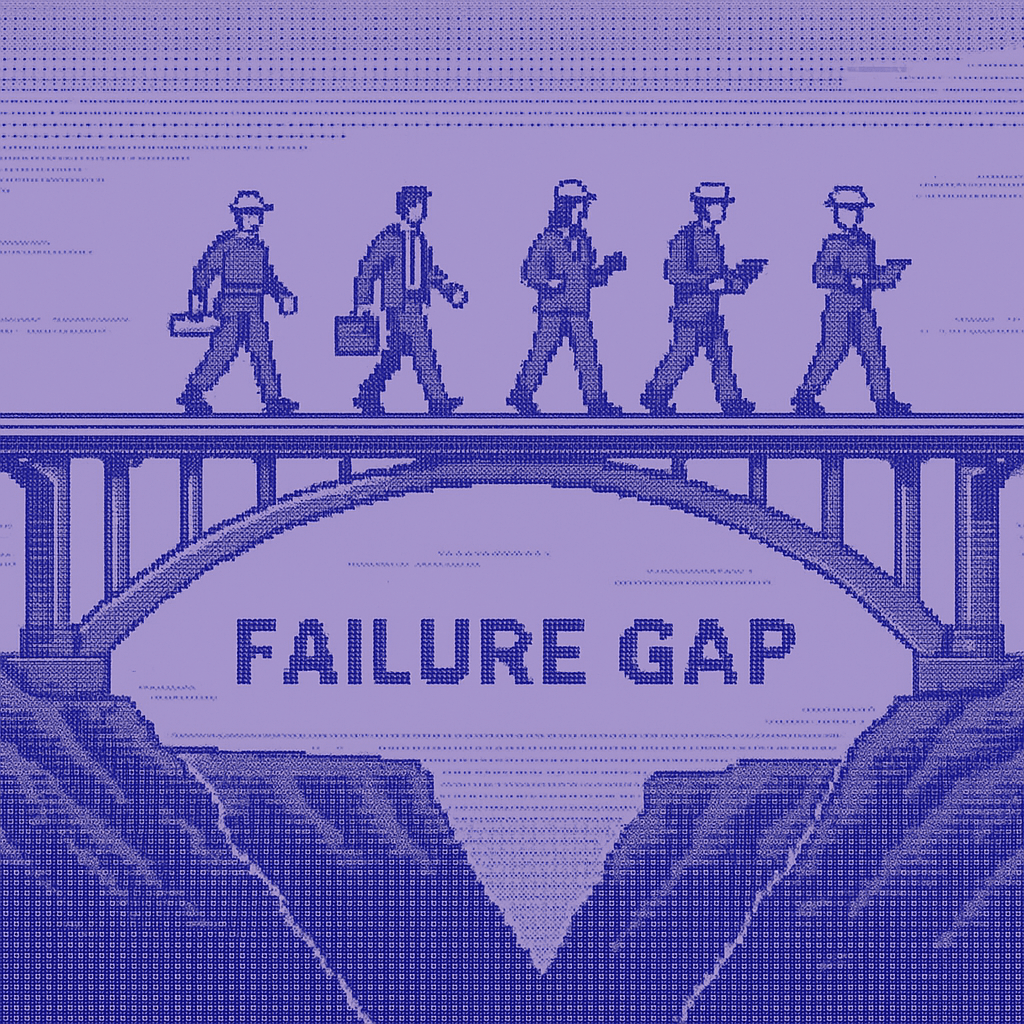
Enterprise AI deployments fail in 73% of cases because standard observability tools cannot track model drift, GPU utilization, or multi-model orchestration across production systems. This guide demonstrates production-tested monitoring architectures, blue-green deployment patterns, and automated remediation strategies—validated across infrastructure managing 400,000+ files and complex multi-service environments.
Production AI deployments fail when teams underestimate infrastructure requirements. The pattern: successful POC demos generate excitement, then engineering discovers their observability stack can't track model drift, CI/CD pipelines can't handle multi-model deployments, and monitoring tools provide no GPU visibility.
AI systems require fundamentally different operations than conventional software. Traditional services tolerate eventual consistency; AI systems need real-time data pipelines. Typical microservices need basic health checks; AI deployments demand continuous drift detection, performance baselines, and automated fallback mechanisms.
This guide provides infrastructure patterns, monitoring architectures, and deployment strategies that work at scale.
Prerequisites: Infrastructure Assessment
Before implementing production AI systems, assess infrastructure against four dimensions:
- Data Processing Infrastructure: Streaming pipelines (Kafka), schema validation at ingestion, circuit breakers for inter-service communication.
- API Integration Architecture: Enterprise gateways with rate limiting and authentication, workflow orchestration (Temporal/Airflow), API versioning for concurrent model versions.
- Monitoring and Observability: OpenTelemetry distributed tracing, health checks that verify model availability, alert rules based on SLO burn rates.
- Performance Metrics: P50/P95/P99 latency tracking, throughput monitoring (RPS, batch rates, queue depths), GPU/CPU/network utilization with capacity projections.
Assessment Protocol
Run three diagnostics before implementation:
- Infrastructure Audit: Document compute resources, network topology, and monitoring coverage percentage.
- Shadow AI Discovery: Scan for unapproved AI tools in browser extensions, IDE plugins, API logs, and hardcoded keys.
- System Complexity Mapping: Build dependency graphs, identify integration hotspots, and document data flows.
Step 1: Infrastructure Assessment and Shadow AI Detection
Infrastructure Discovery
Baseline visibility starts with identifying existing AI workloads and resource consumption patterns. This script surfaces GPU utilization, active AI processes, and external API calls that teams may not know about.
Shadow AI Detection
Unauthorized AI tool usage creates security exposures and bypasses governance. This detector scans network logs and repositories for unapproved AI services, hardcoded API keys, and external AI endpoints that fragment your compliance strategy.
Step 2: System Architecture and Integration Design
AI Data Pipeline
AI systems fail when data pipelines can't maintain ordering guarantees or handle model failures gracefully. This pipeline implements strong consistency (acks='all'), maintains message ordering (max_in_flight=1), validates input quality, and provides automatic fallback to secondary models when primary endpoints fail.
Kubernetes Configuration
Standard Kubernetes deployments kill AI services before models finish loading. This configuration uses startup probes with extended timeouts (30 attempts × 10s = 5 minutes) because model initialization takes 30-60 seconds. Resource limits prevent noisy neighbor problems, and separate liveness/readiness probes distinguish between "crashed" and "not ready for traffic."
Step 3: Monitoring Framework
AI System Monitor
Standard APM tools miss AI-specific failures like gradual accuracy degradation and GPU memory leaks. This Prometheus-based monitor tracks inference requests by model version and status, measures latency distributions with histogram buckets optimized for AI response times (100ms to 10s), and exposes GPU metrics for capacity planning.
Grafana Dashboard
Dashboards must surface actionable insights during incidents. This configuration focuses on P99 latency (worst user experience, not averages), error rates with visual thresholds (orange at 1%, red at 5%), and model-specific request rates for identifying problematic deployments. Query intervals of 5 minutes balance responsiveness with metric stability.
Step 4: Production Deployment
Model Manager
Model deployments need instant rollback when problems occur. This manager tracks model state (loading/ready/failed), counts consecutive health check failures to prevent flapping, and automatically routes requests to fallback models when primary endpoints degrade. The deployment history enables quick rollback to known-good versions.
Blue-Green Deployment
Traditional deployments risk user-facing failures. Argo Rollouts deploys new model versions to preview environments, runs automated analysis (success rate must stay ≥95%), and requires manual promotion before switching production traffic. The prePromotionAnalysis validates behavior before customers see changes.
Step 5: Automated Remediation
Production issues need immediate response, not human intervention. This health monitor continuously checks system metrics and executes registered remediation actions when conditions trigger. Example: scale up replicas when P99 latency exceeds 5 seconds, preventing incident escalation while on-call engineers investigate root causes.
Common Pitfalls
- Deploy observability before features. Monitoring infrastructure goes live before AI services. You cannot debug what you cannot measure.
The New Code Review Workflow for AI-Native Engineering Teams
See how leading teams keep code review fast and rigorous as AI writes more of the code.
- Version everything with rollback capabilities. Models, inference code, configuration, input processing logic all versioned together.
- Monitor the entire request path. Track ingestion pipelines, preprocessing, inference, post processing, response delivery.
- Ignore shadow AI at your own risk. Unmonitored AI creates security exposures, unpredictable costs, compliance violations.
- Model accuracy is not a production metric. Monitor latency, error rates, throughput, drift. A 99% accurate model that takes 30 seconds is useless.
What You Should Do Next
Production AI deployments succeed when teams prioritize infrastructure and observability.
- Start with shadow AI detection and infrastructure readiness assessment (1-2 weeks)
- Build a monitoring framework before deploying to production (2-3 weeks)
- Implement blue-green deployments with automated validation (2-3 weeks)
Accelerate Your Implementation with Augment Code
Implementing comprehensive monitoring, deployment automation, and infrastructure-as-code requires thousands of lines of configuration. Augment Code's advanced Context Engine understands your infrastructure patterns, suggesting Kubernetes configurations, Prometheus queries, and Python monitoring code that aligns with your existing architecture.
When implementing observability frameworks, the platform provides monitoring code matching your team's patterns. When setting up deployment automation, it suggests Argo Rollouts configurations integrating with your CI/CD pipelines. SOC 2 Type II certification and customer-managed encryption keys ensure development tools meet production security standards.
Try Augment Code for context-aware development that understands your production patterns, suggests configurations matching your architecture, and accelerates infrastructure work for reliable AI systems.

Frequently Asked Questions
Related Articles
AI Implementation & Infrastructure
- AI Agent Workflow Implementation Guide for Dev Teams
- Top DevOps Solutions to Streamline Enterprise Delivery
- 23 Best DevOps Testing Tools to Supercharge Your CI/CD
Monitoring & Quality Assurance
- 12 Code Quality Metrics Every Dev Team Should Track
- Why AI Code Reviews Prevent Production Outages
- Context-Driven Quality Assurance
Security & Compliance
- AI Code Security: Risks & Best Practices
- SOC 2 Type 2 for AI Development: Enterprise Security Guide
- How Can Developers Protect Code Privacy When Using AI Assistants?
AI Coding Tools for Enterprise
Written by

Molisha Shah
Molisha is an early GTM and Customer Champion at Augment Code, where she focuses on helping developers understand and adopt modern AI coding practices. She writes about clean code principles, agentic development environments, and how teams are restructuring their workflows around AI agents. She holds a degree in Business and Cognitive Science from UC Berkeley.